
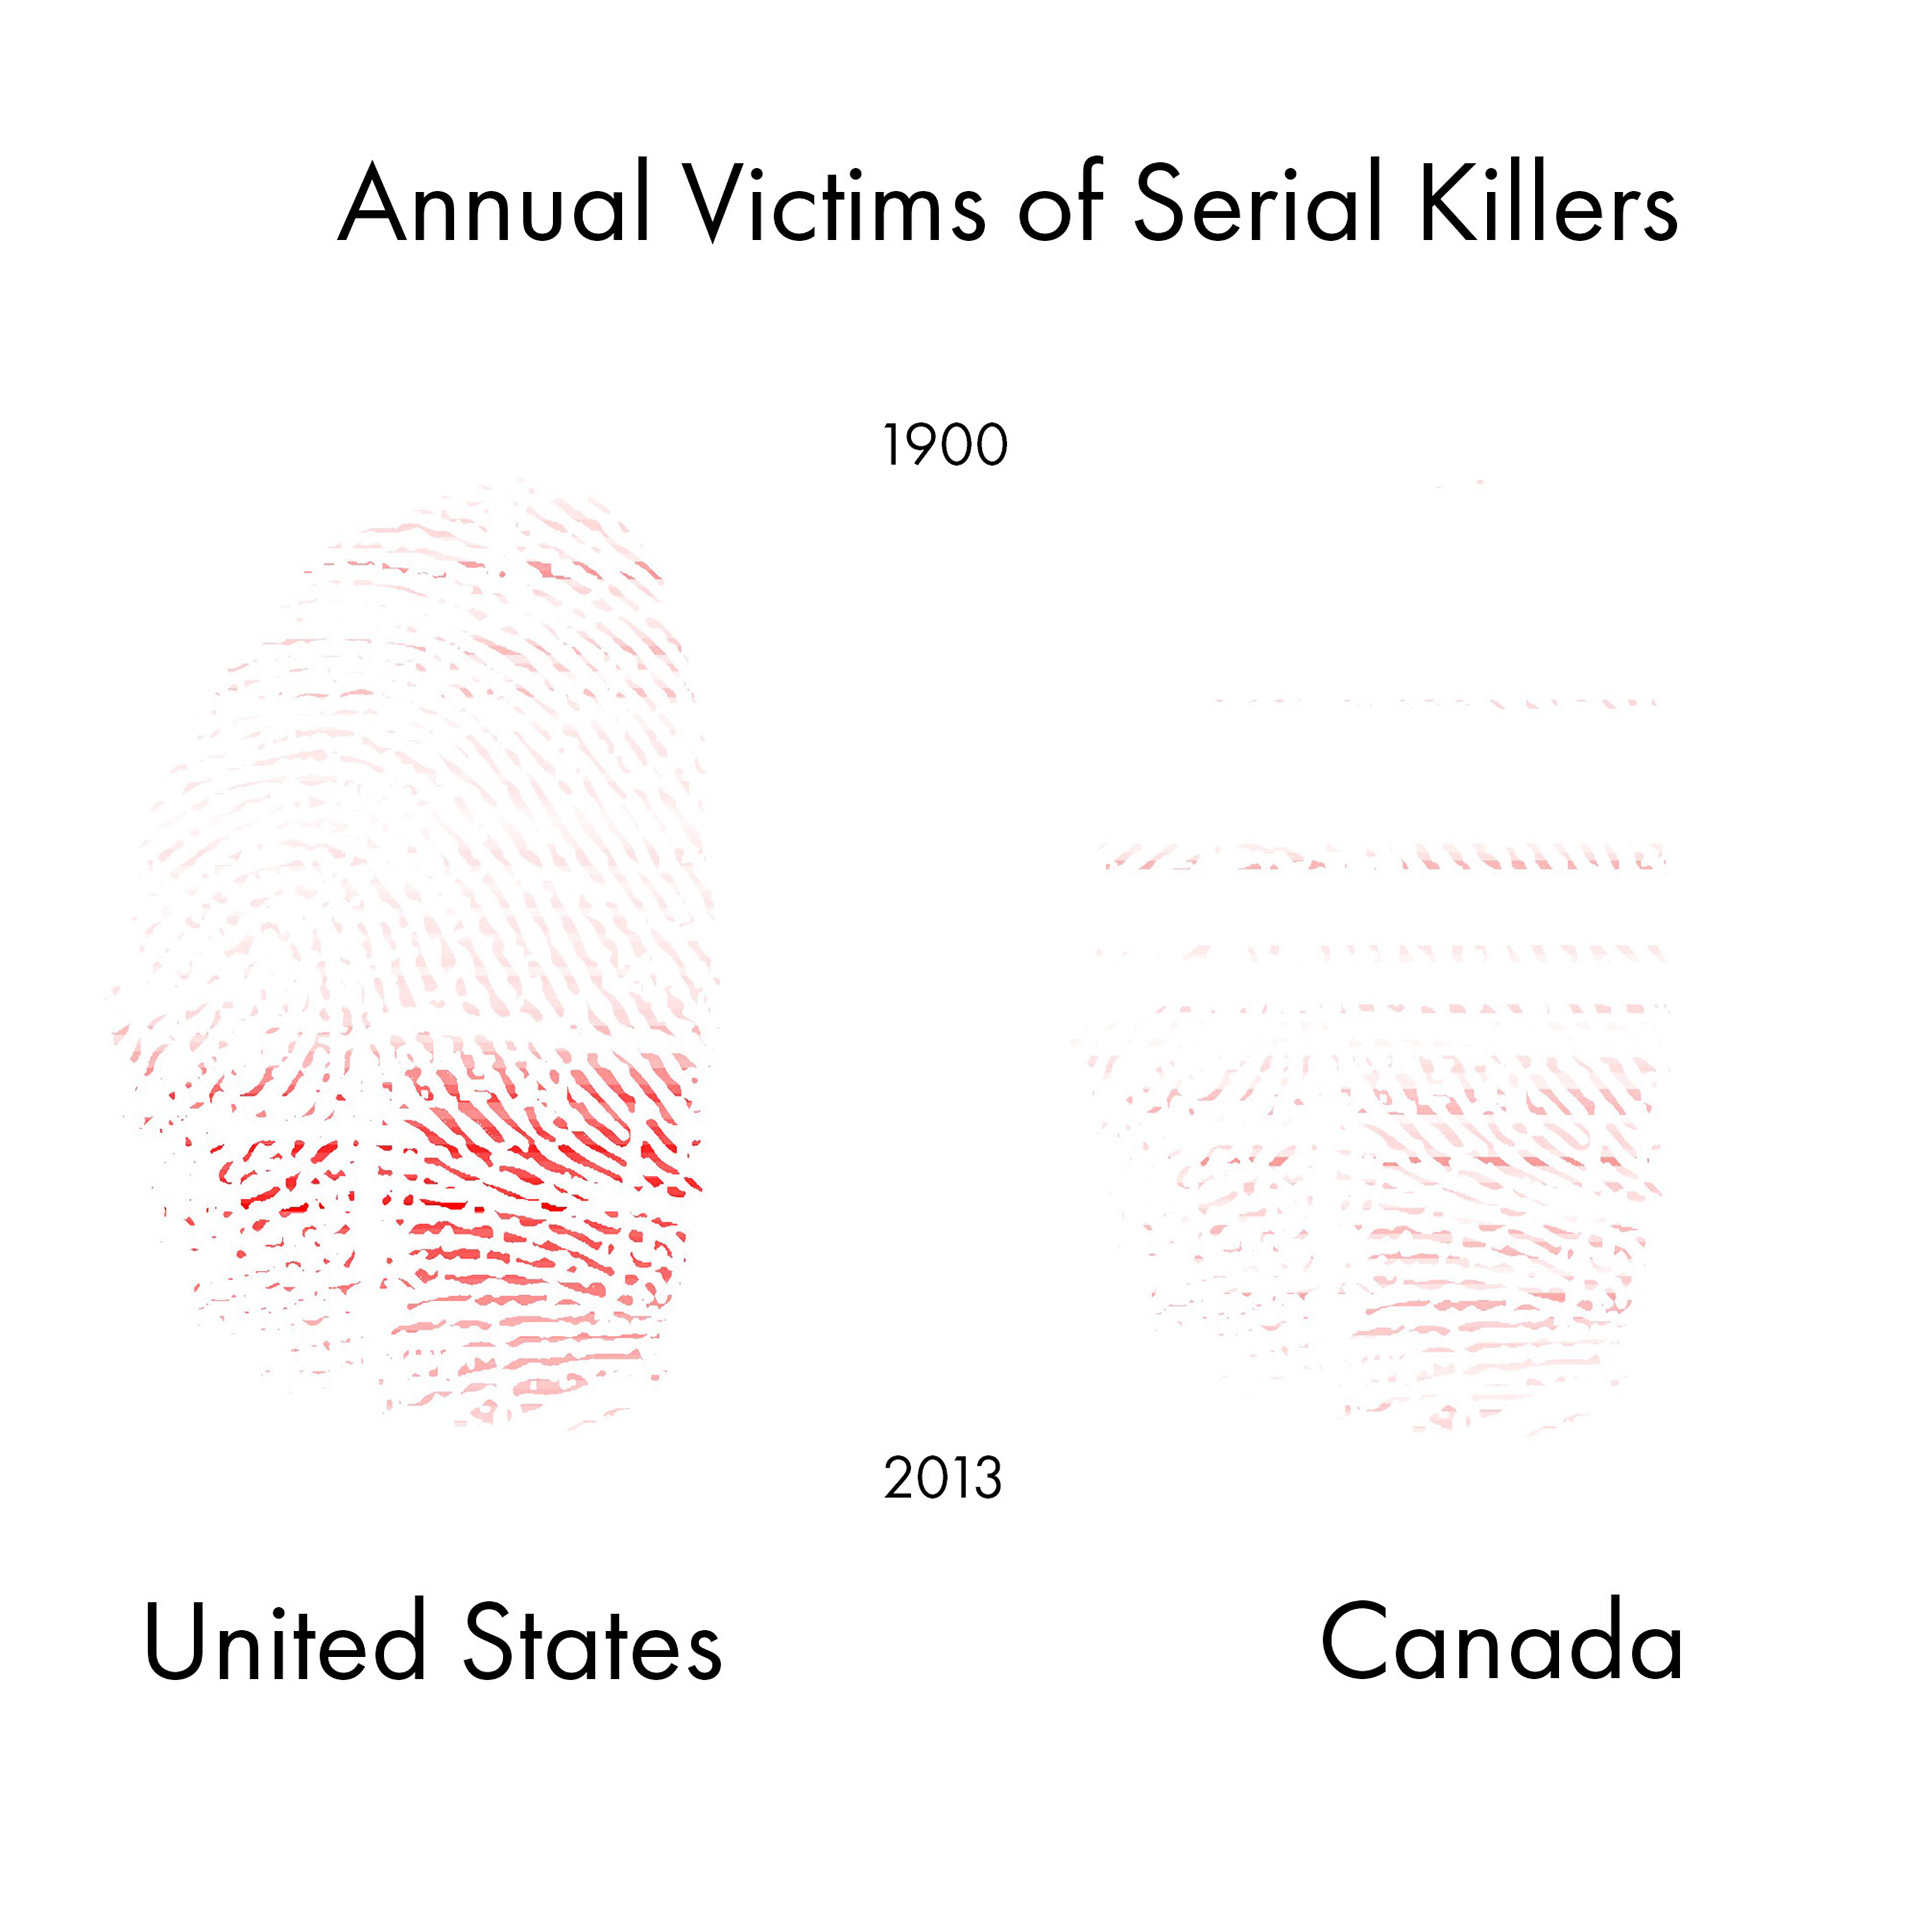
I made this project in under 24 hours, as a challenge posed by Deutsch for all their fellowship applicants. It's a "Data Art" piece about the annual victims of serial killers in the United States and Canada, normalised by population.
Their challenge was simple: "Make something new!" Since I'm currently in a Data Art class, I thought, "Why not?" Plus, it would give me a chance to play around with an unusual data set.
Process
1) I found an interesting dataset collected by Radford University about serial killers, and I was immediately drawn to this somewhat macabre topic. All the data can be found here:
2) To present an accurate picture, I wanted to normalise the data according to population. Finding that data was actually more irritating than one might imagine, and because I was using so many different sources (and the data sets were relatively small), I decided to complie all of it, both the population, and the serial killer data, into an Excel Workbook, and export it as a CSV file.
Here are the sources for my data:
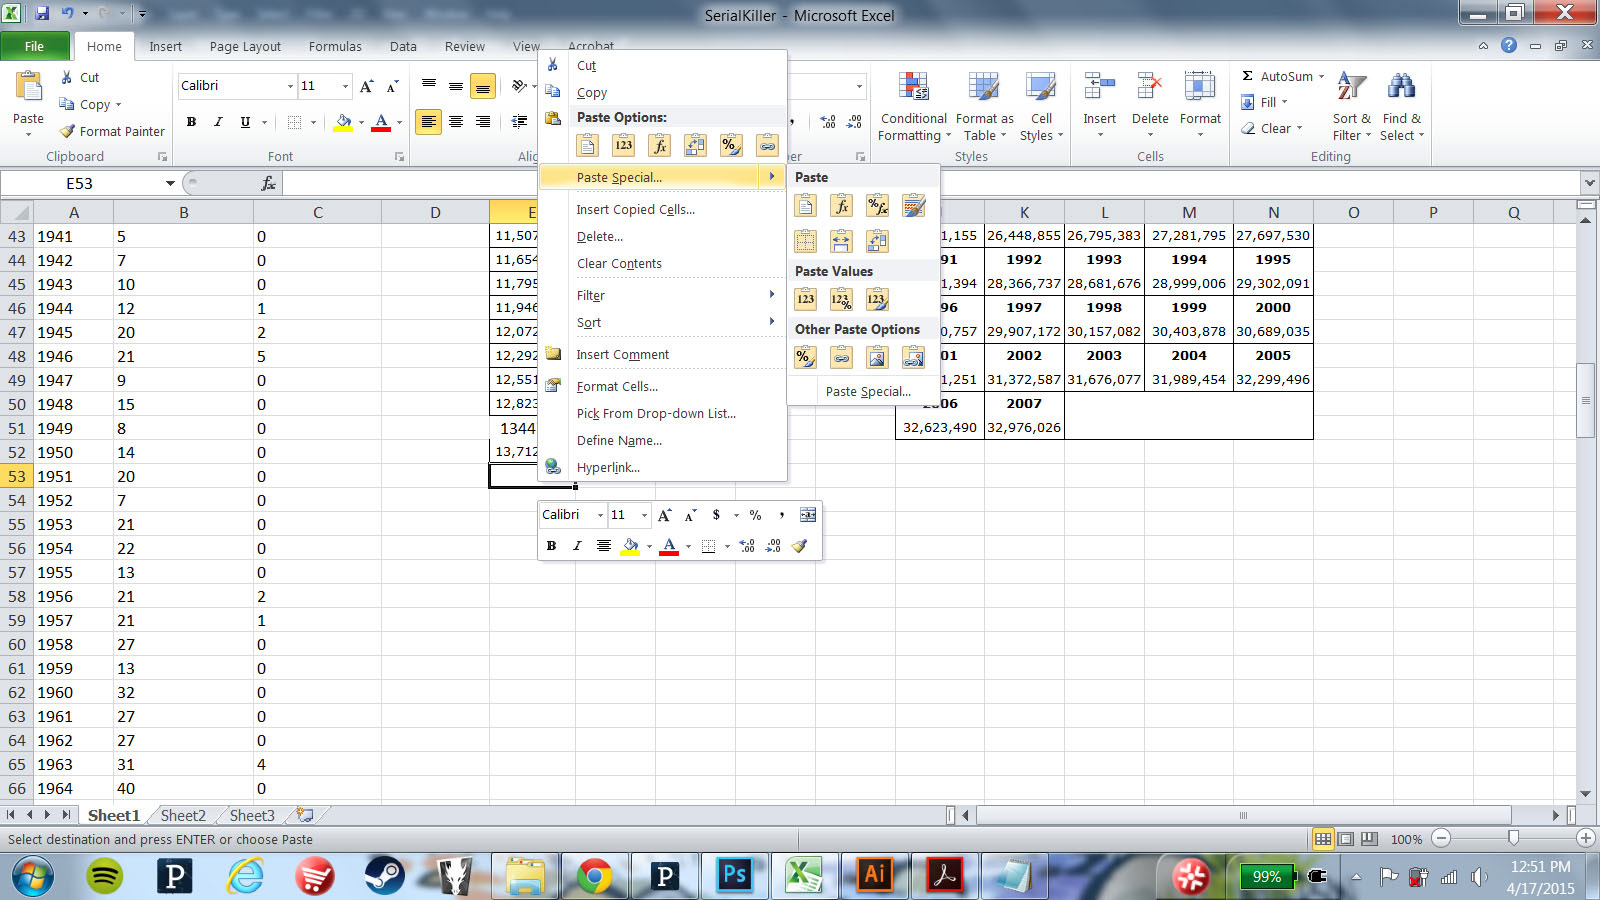
Fiddly and annoying data
3) I then found a real set of fingerprints on Wikimedia Commons, and manipulated it using Photoshop and Illustrator to produce something easily parsed in Processing. Since it was a Data Art project, I really wanted to use a real set of fingerprints, even if I was going to manipulate it later.
Here's my image source:
http://www.grimesandwarwick.com/wp-content/uploads/2013/06/Fingerprints_taken_by_William_James_Herschel_1859-1860.jpg
http://www.grimesandwarwick.com/wp-content/uploads/2013/06/Fingerprints_taken_by_William_James_Herschel_1859-1860.jpg

Yay for free images!

Photoshop and Illustrator Magic

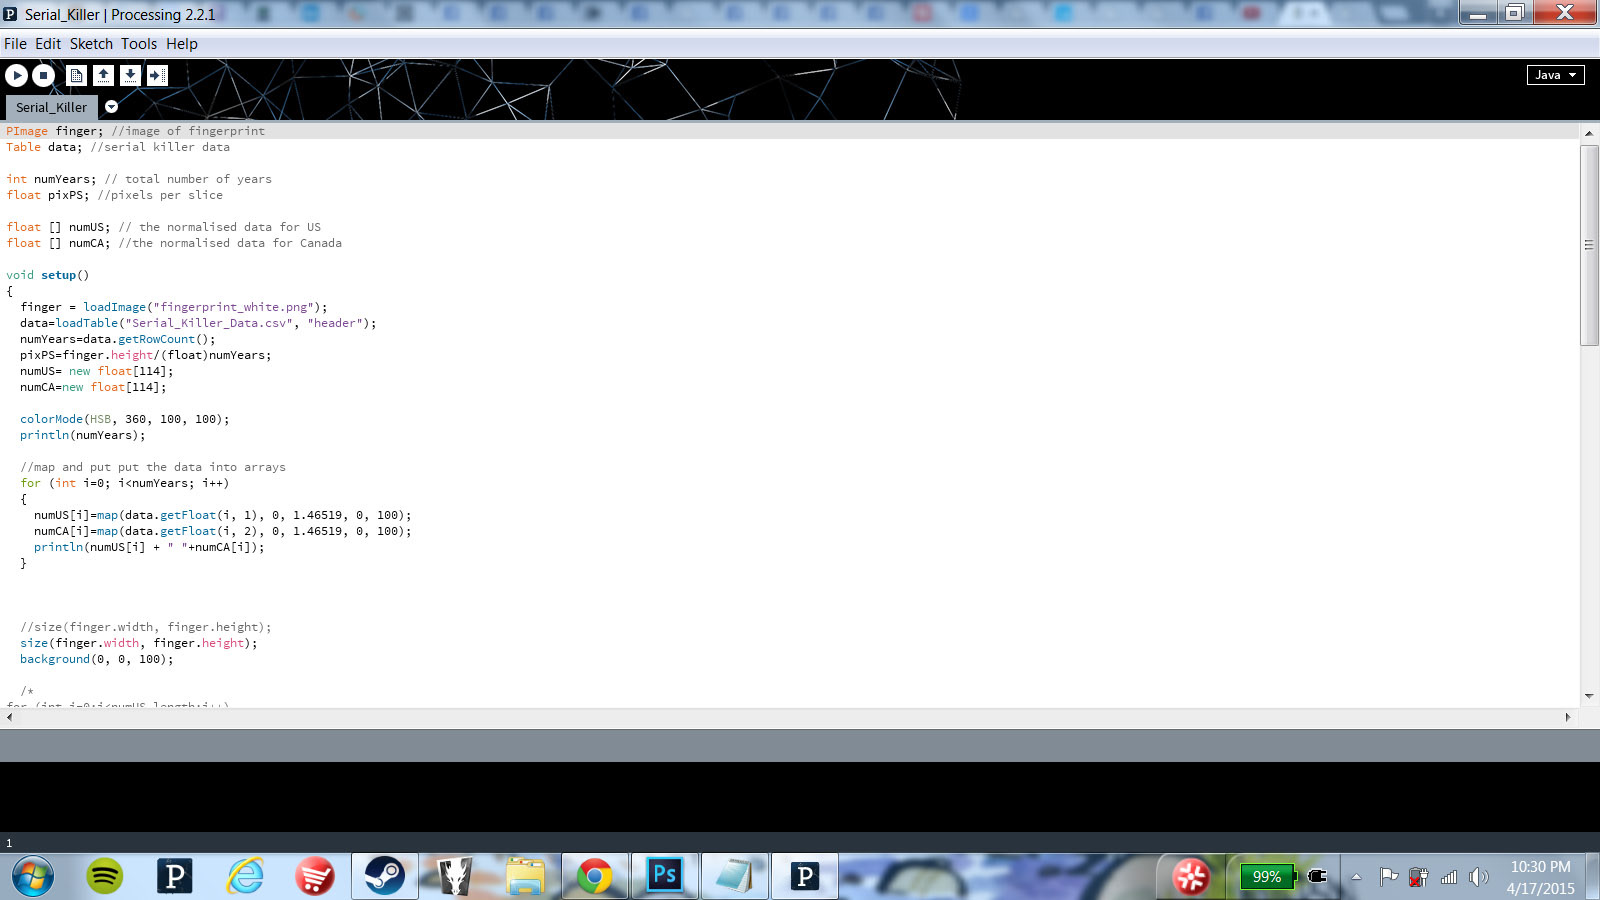
Ready to import into Processing
4) Finally, after a couple of hours of irritating logic errors, I got the visual that I wanted, which I then finished up in Photoshop!

My "Canadian" result from Processing
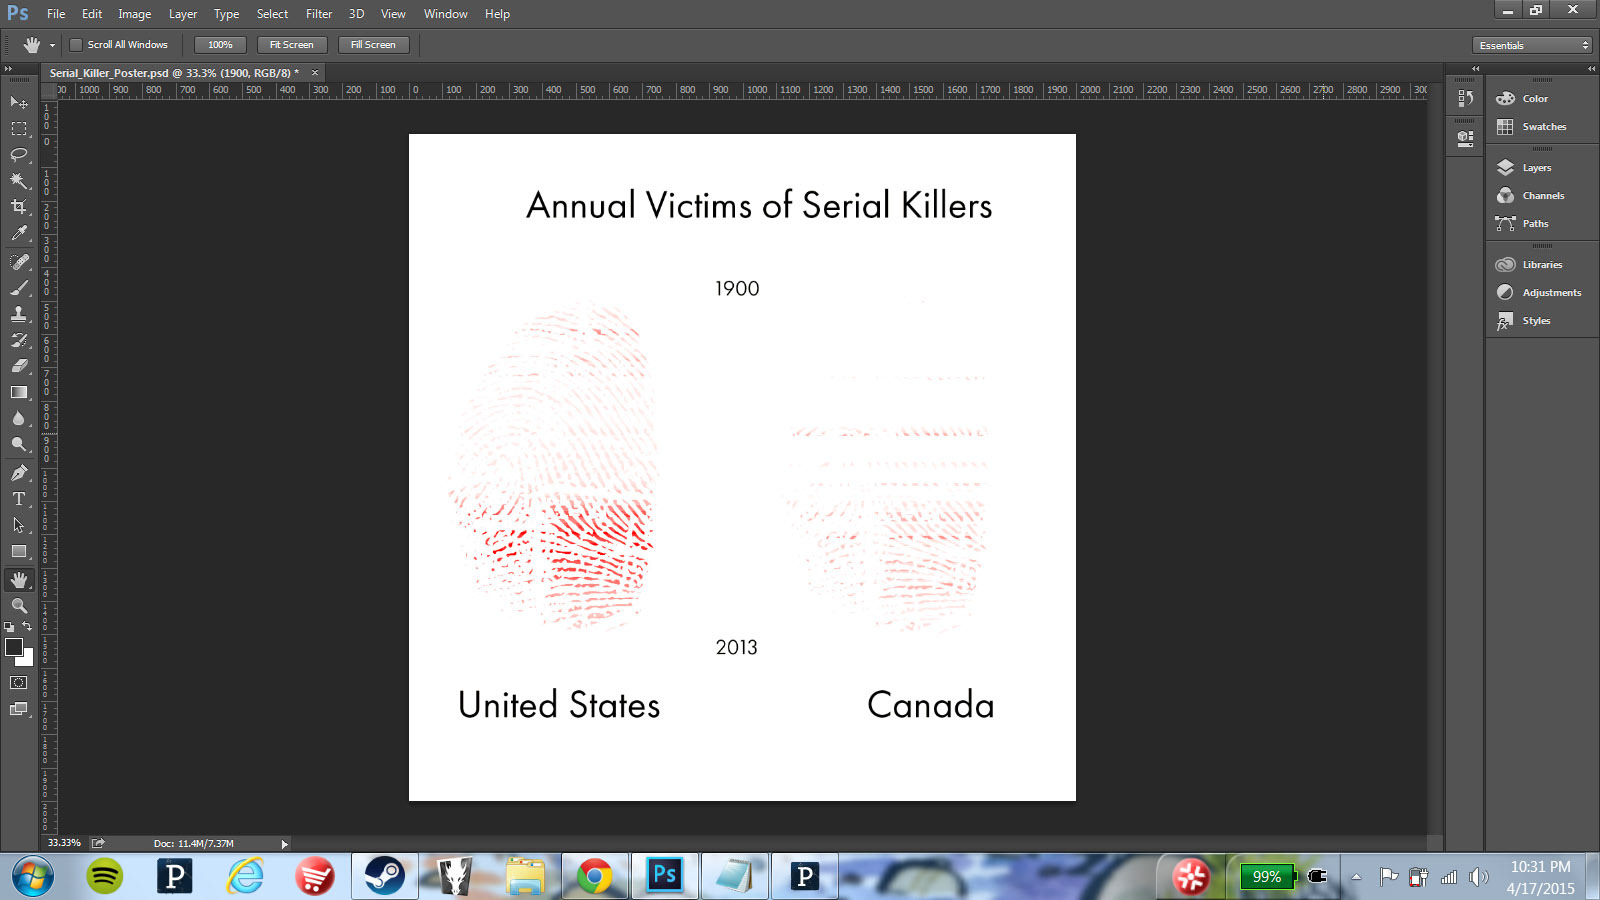
Finishing up.
All in all, a pretty fun way to spend a day!